©Manufacturer
Manufacturer Model
SKU: 000
Tested with driver OS (FW: FW) on 01.01.2025
(Please click (+/-) to open/close the details)

Bright Light
N/A
Light Skin-Tone
N/A
Dark Skin-Tone
N/A
No face present
N/A
Mid Light
N/A
Light Skin-Tone
N/A
Dark Skin-Tone
N/A
No face present
N/A
Low Light
N/A
Light Skin-Tone
N/A
Dark Skin-Tone
N/A
No face present
N/A
N/A /100
- Apple_MacbookProM4
Image Quality Attributes
These radar charts provide a concise visual summary of a webcam’s performance, enabling clear assessment of overall image quality and skin tone representation across key technical metrics and real-world conditions.
How to interpret the charts
(click on the rectangles to show/hide individual lines)
| Bright Light | Mid Light | Low Light | |
|---|---|---|---|
| Contrast & DR | N/A | N/A | N/A |
| Timing | N/A | N/A | N/A |
| Noise | N/A | N/A | N/A |
| Color | N/A | N/A | N/A |
| Spatial Frequency Response | N/A | N/A | N/A |
| Dynamic Response | N/A | N/A | N/A |
| White Balance | N/A | N/A | N/A |
| Exposure | N/A | N/A | N/A |
(click on the rectangles to show/hide individual lines)
| Light Skin-Tone | Dark Skin-Tone | No face present | |
|---|---|---|---|
| Color | N/A | N/A | N/A |
| Spatial Frequency Response | N/A | N/A | N/A |
| Dynamic Response | N/A | N/A | N/A |
| White Balance | N/A | N/A | N/A |
| Exposure | N/A | N/A | N/A |
Test Sequence
VCX-Webcam introduces standardized tests that reflect real-world webcam use, focusing on dynamic performance metrics like exposure, white balance, stability, and face rendering. Key tests simulate lighting changes, challenging environments, and user movement.
How to interpret the diagrams
720p (HD)
autoExposure
autoWhite Balance
1080p (FHD)
autoExposure
autoWhite Balance
2160p (4K)
autoExposure
autoWhite Balance
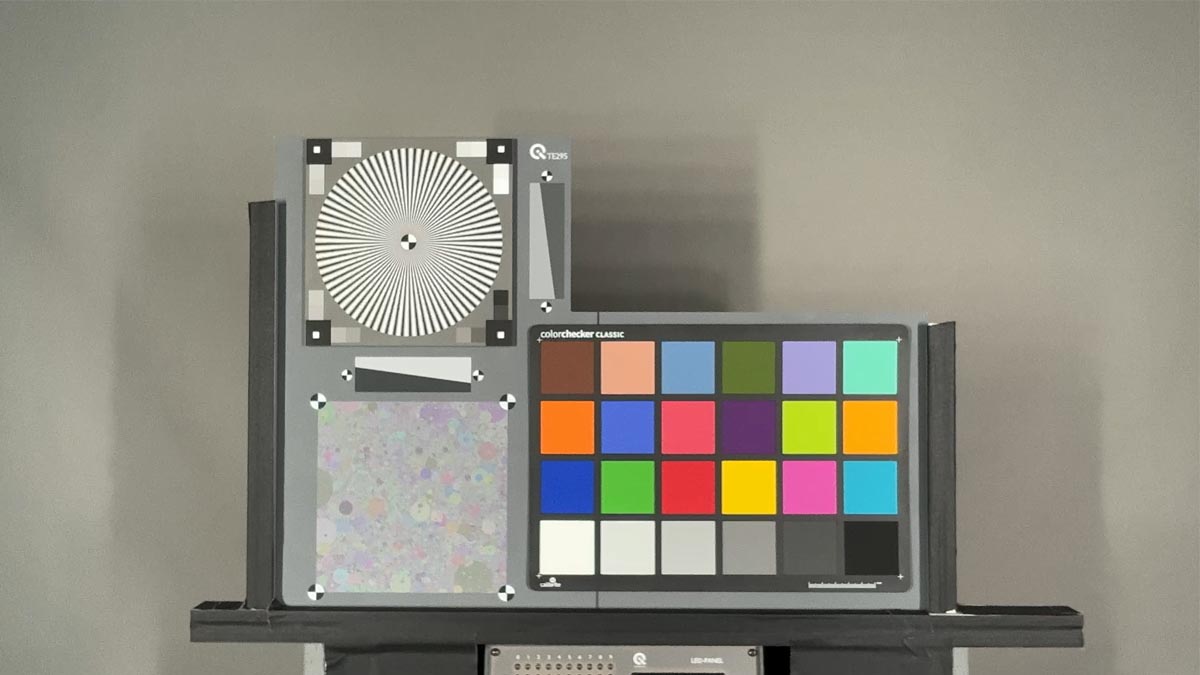
Image Quality Comparison
Move around the orange bordered box on the test chart image or drag one of the comparison images to pan.
Loading...
Loading...