PhoneCam Test
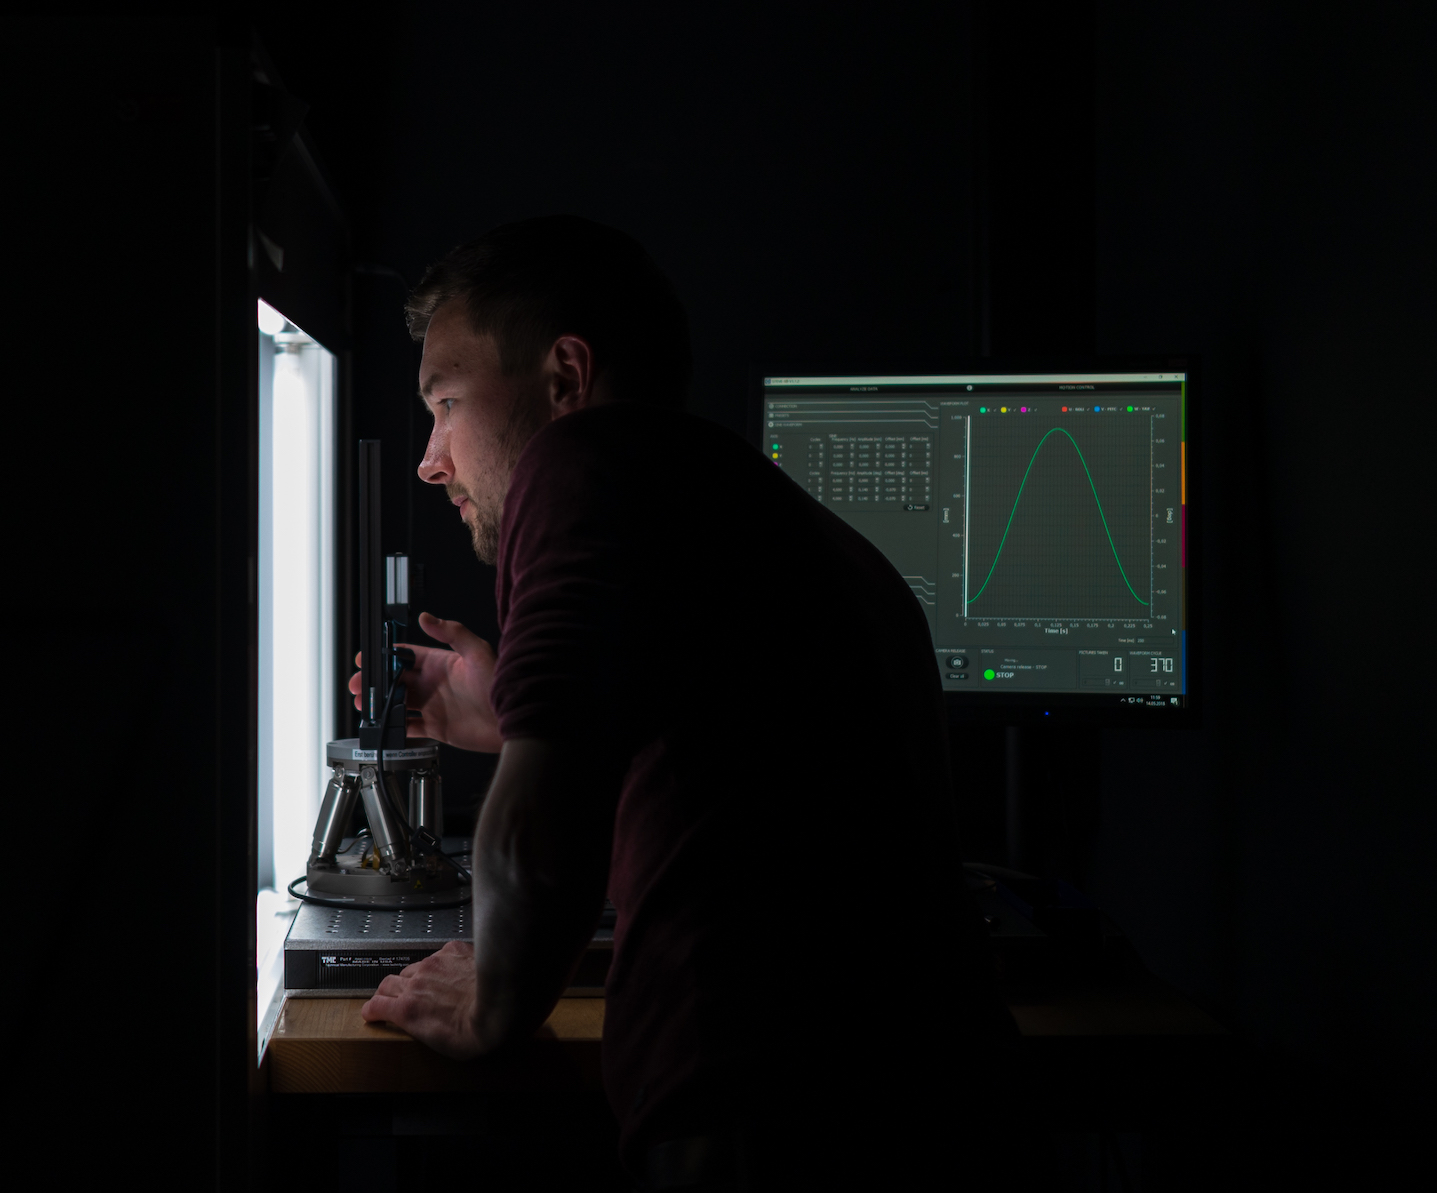
The VCX test measurement is currently updated to the 2025 version. In this latest version, the overall structure has been reorganized to improve clarity and consistency. Rather than grouping metrics under lighting conditions, VCX 2025 positions each test item—such as Texture, Resolution, or Color—as a primary category, with lighting conditions (Bright, Indoor, Low Light) evaluated within each. The selfie camera test remains included, and the rear camera test has been further extended to cover a wider variety of capturing environments, including video, ultra-wide angle, and zoom scenarios. The image quality test is divided by metric, and each is evaluated under three lighting conditions: Sunny, Indoor, and Night. Furthermore, considering that many VCX Forum members recognize the challenge of taking pictures in dark environments, the camera is additionally tested in six separate faint lighting scenarios defined as the Extended Low Light condition, which now stands as an independent evaluation item. With this enhanced configuration, the updated version offers a more comprehensive view of camera performance.
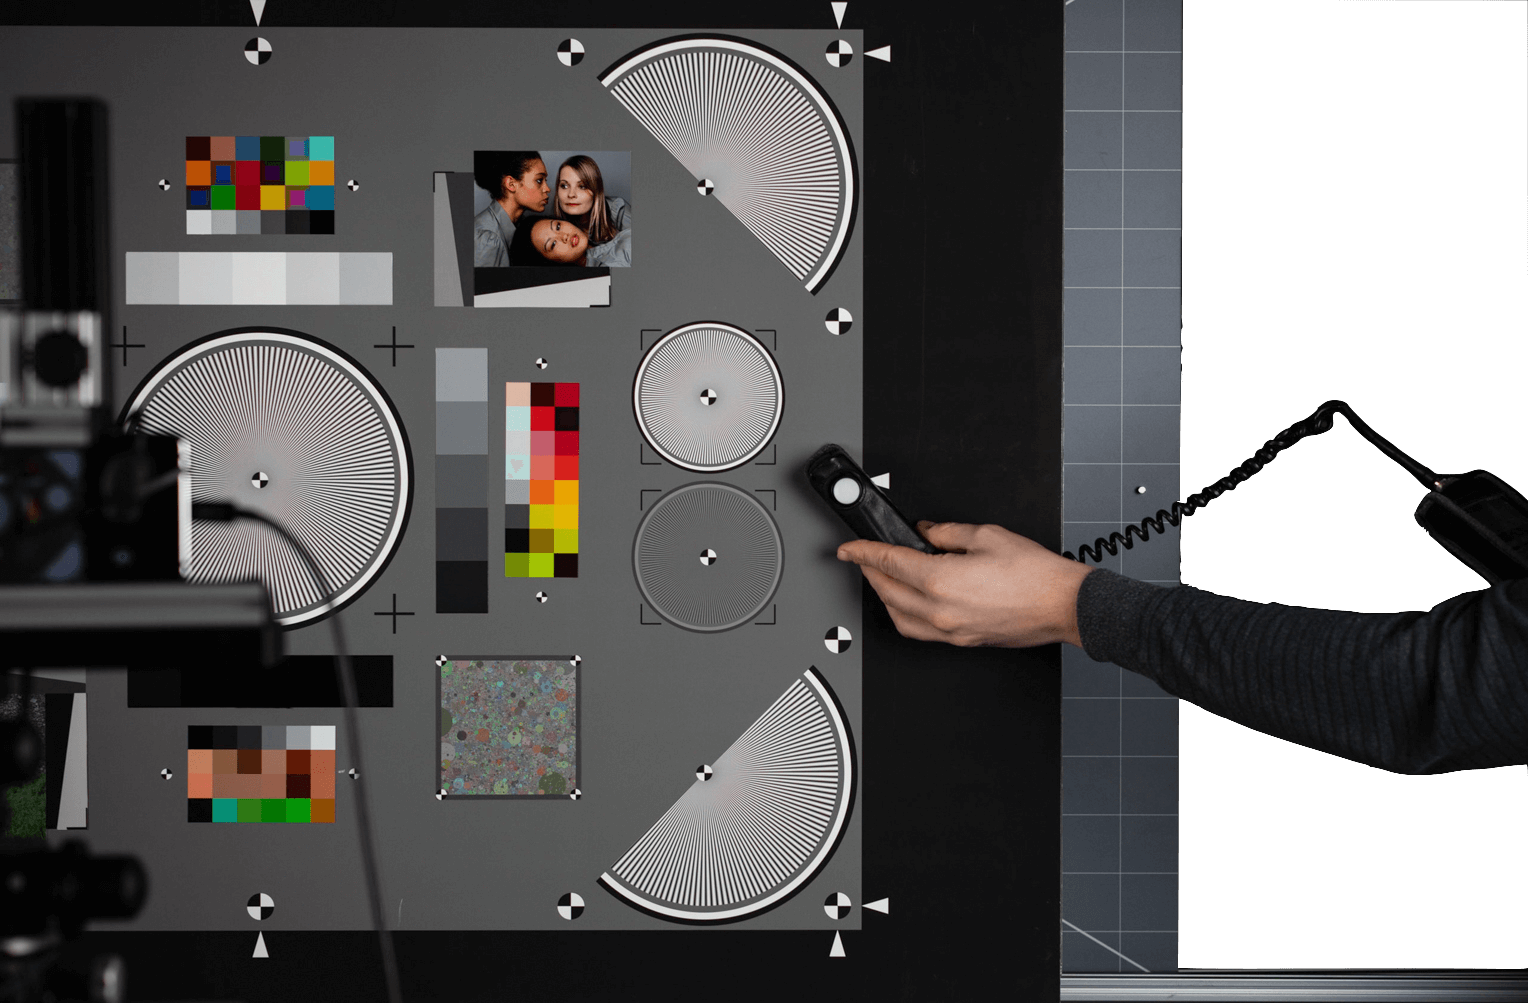
Test condition
Variables are controlled and kept constant throughout the test. Any changes in a variable during an experiment or between tests would invalidate the correlation between dependent and independent variables, potentially skewing the results.
Ideally, one image contains all the information needed to evaluate various aspects of image quality, such as dynamic range and sharpness.
Factory default settings are used, and the default camera application with automatic exposure control is applied. The analysis is performed based on the final JPG image, utilizing the internal image processing pipeline of the device.
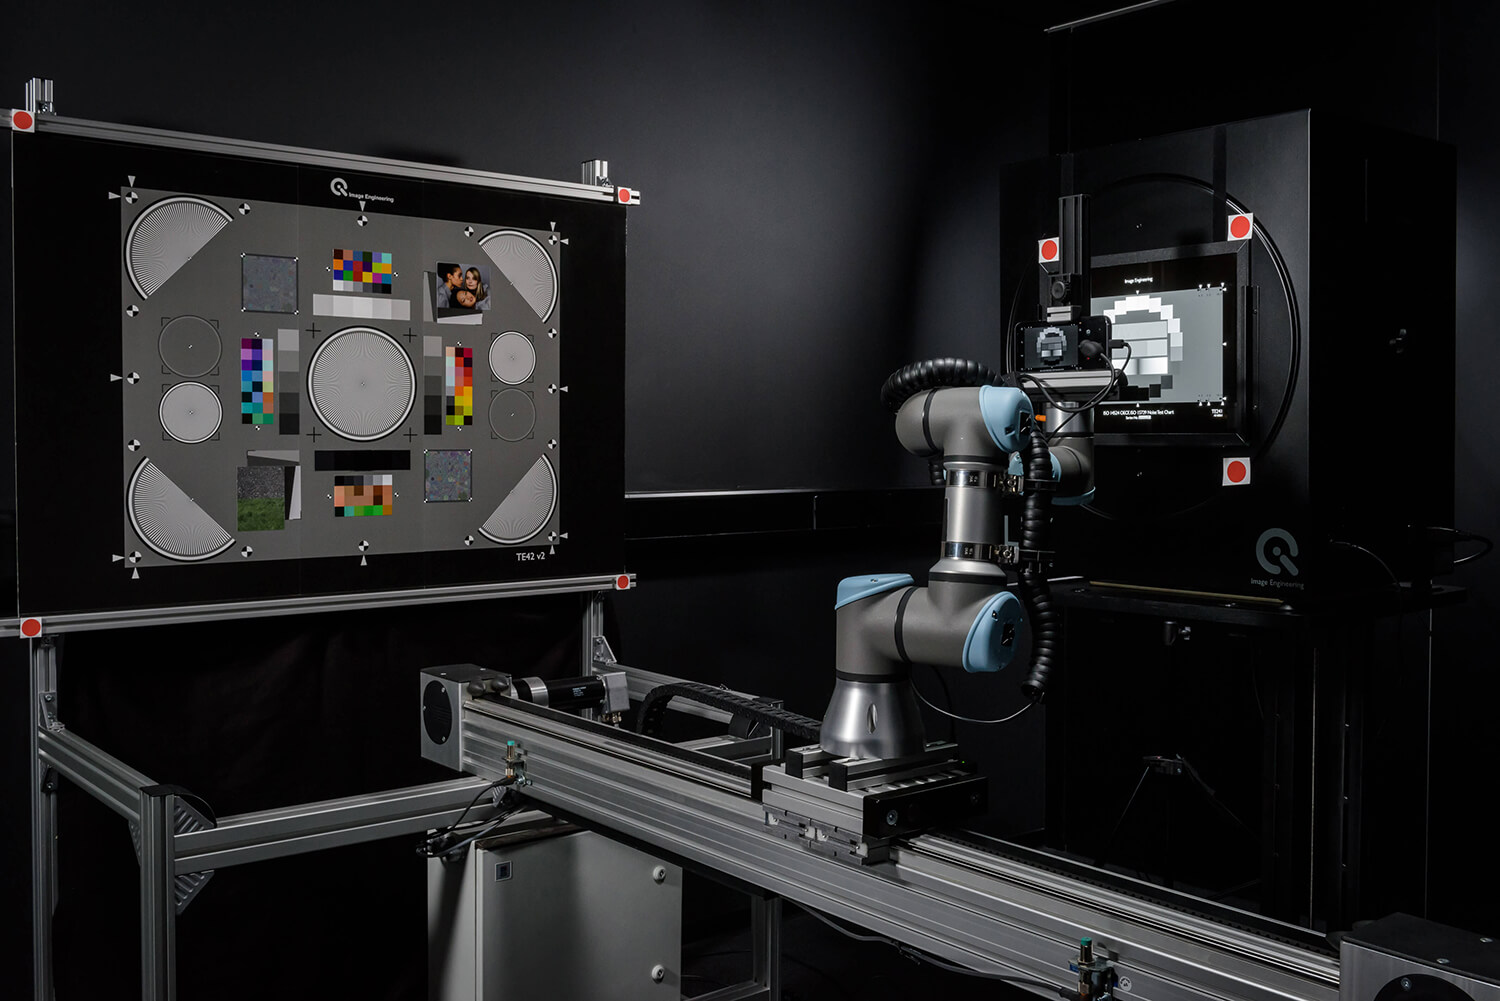
The image quality evaluation based on the TE42 LL test chart is performed under different lighting conditions:
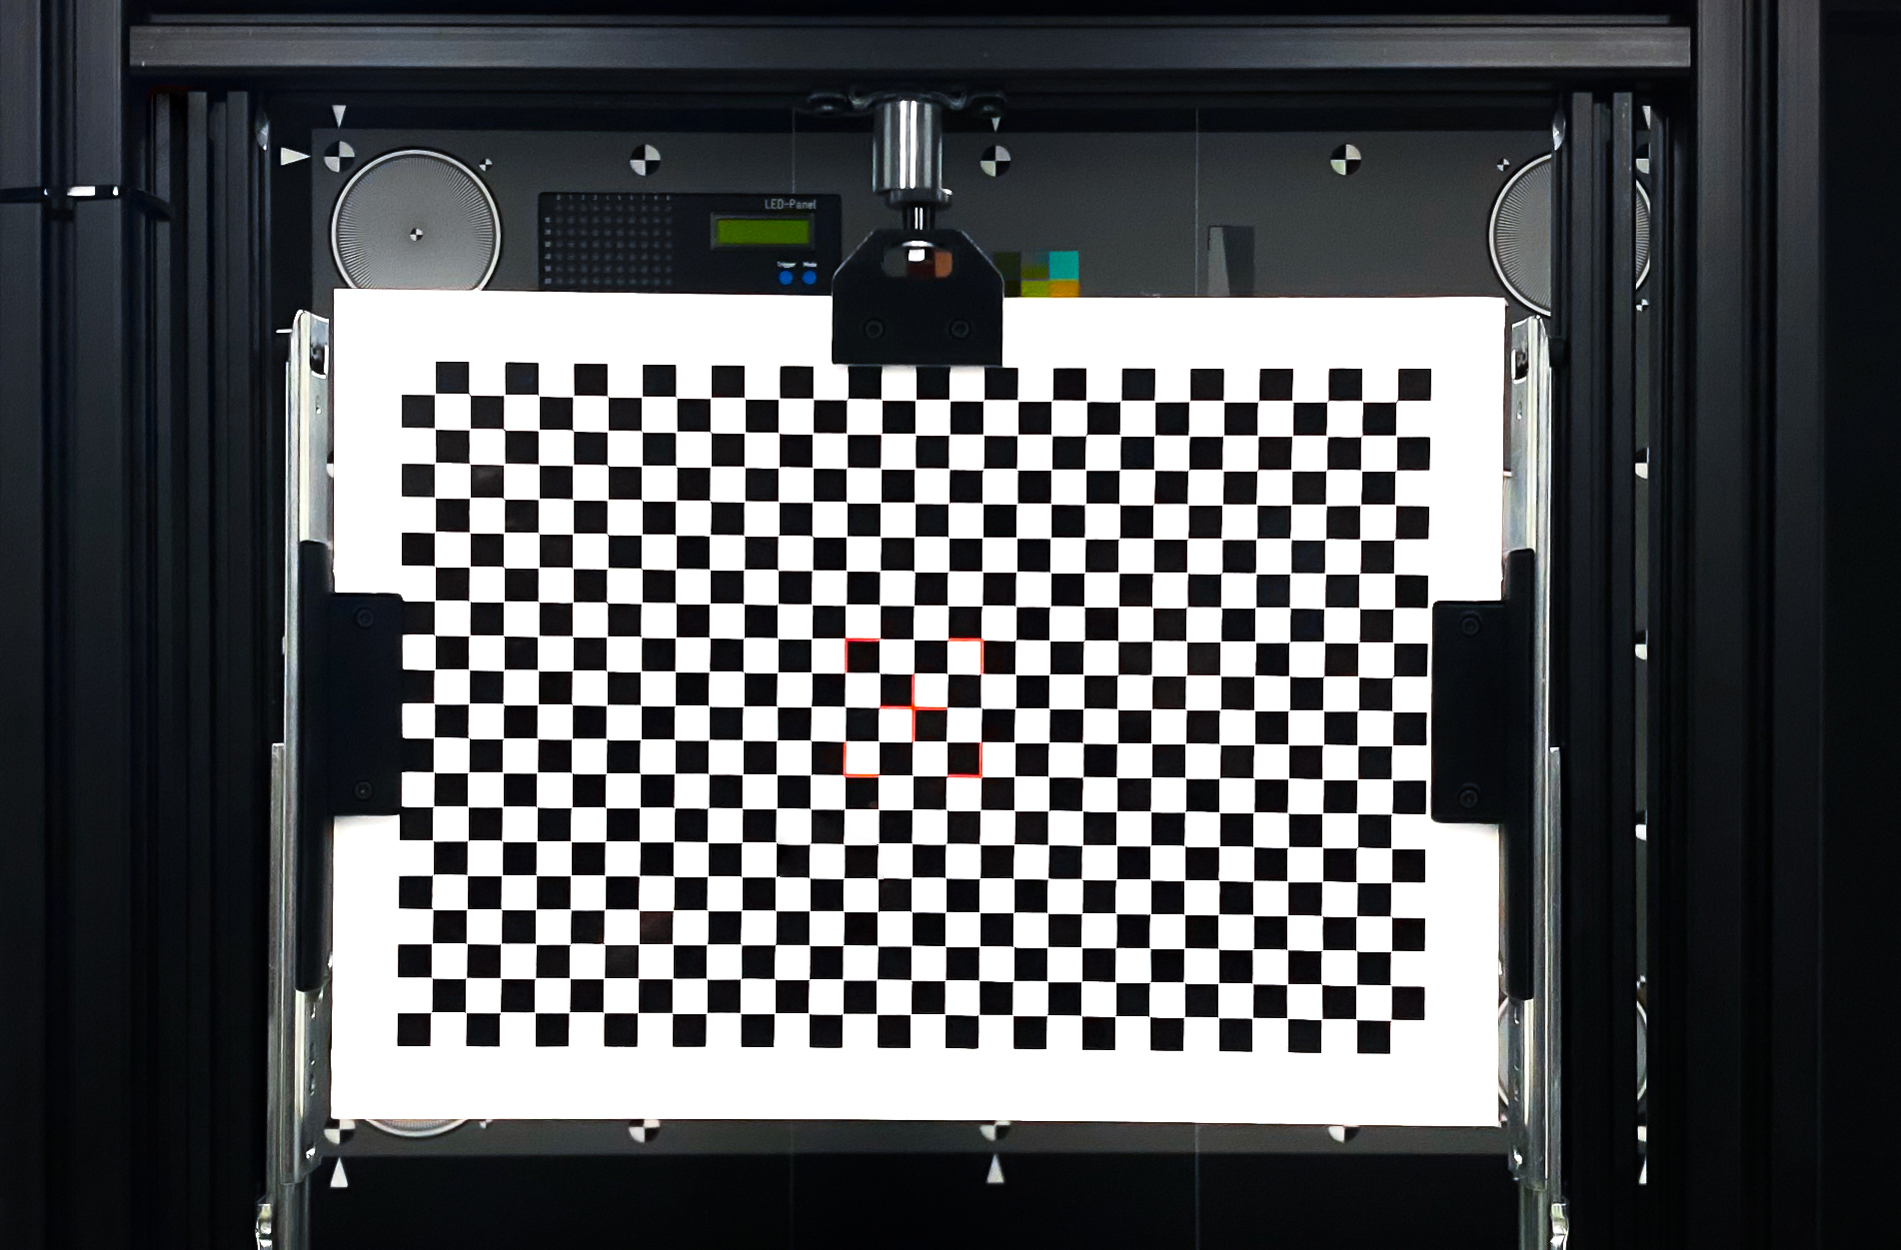
The metrics in the part “Response Time” are measured using the TE42-LL chart as well as LED panel.
In the shooting time lag test, the device is first given time to focus on a near-focus-chart as a controlled starting point. This chart is then quickly removed to allow the device to focus on the far-focus-chart. This setup ensures controlled and repeatable autofocus performance measurements. The position of the first LED is used to determine the start of exposure.
Unlike traditional frame rate measurements, which report frames per second, VCX measures and reports the time required to capture 10 consecutive images for a more practical and stress-oriented evaluation.
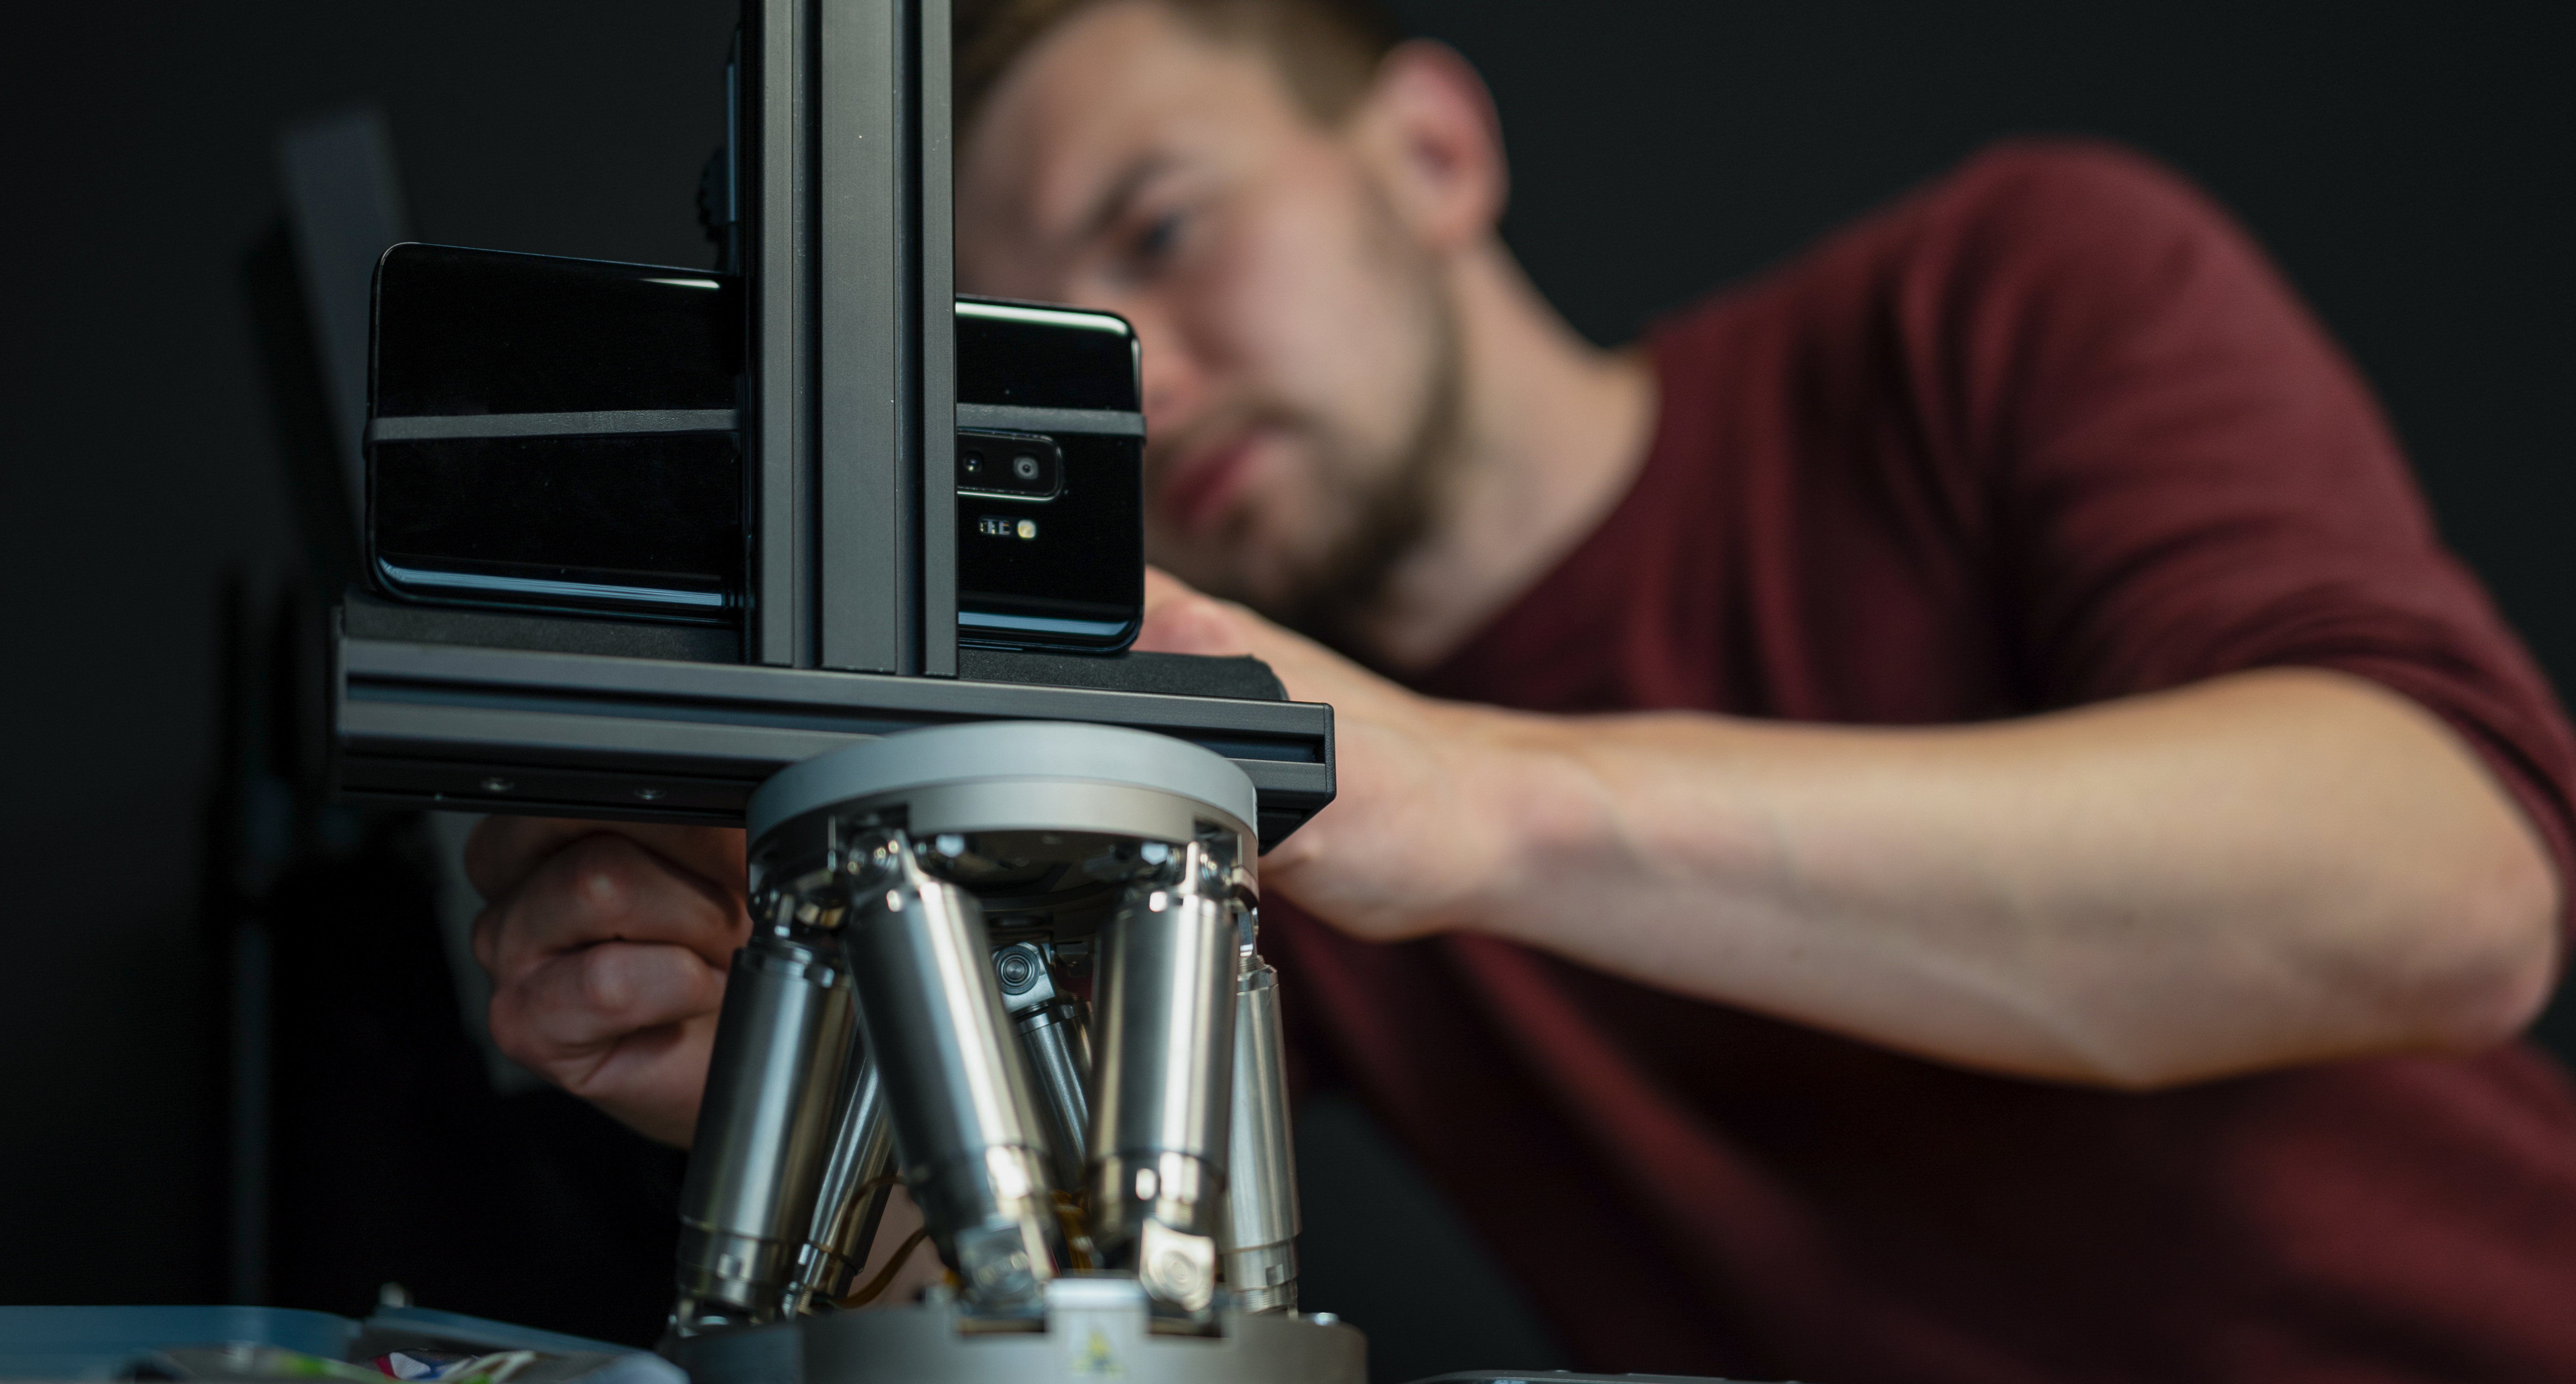
The analysis is conducted using software verified for compliance with IQ-Analyzer and VCX’s open-sourced tool. All measurements are computed through an objective, fully automated process with no manual intervention. In VCX 2025, the metric structure and lookup tables (LUTs) have been refined to improve performance differentiation—particularly in the mid-score range. Over 350 test metrics are integrated into the final VCX score, and the relative weight of each metric is determined collaboratively by VCX Forum members. For example, Acutance in the Texture and Resolution categories carries more weight, while subjective metrics like Color are deliberately weighted lower (e.g., 4%).
Lighting condition contributions have also been standardized across all metrics: Bright (31%), Indoor (28%), and Low Light (41%), reflecting real-world usage more accurately.
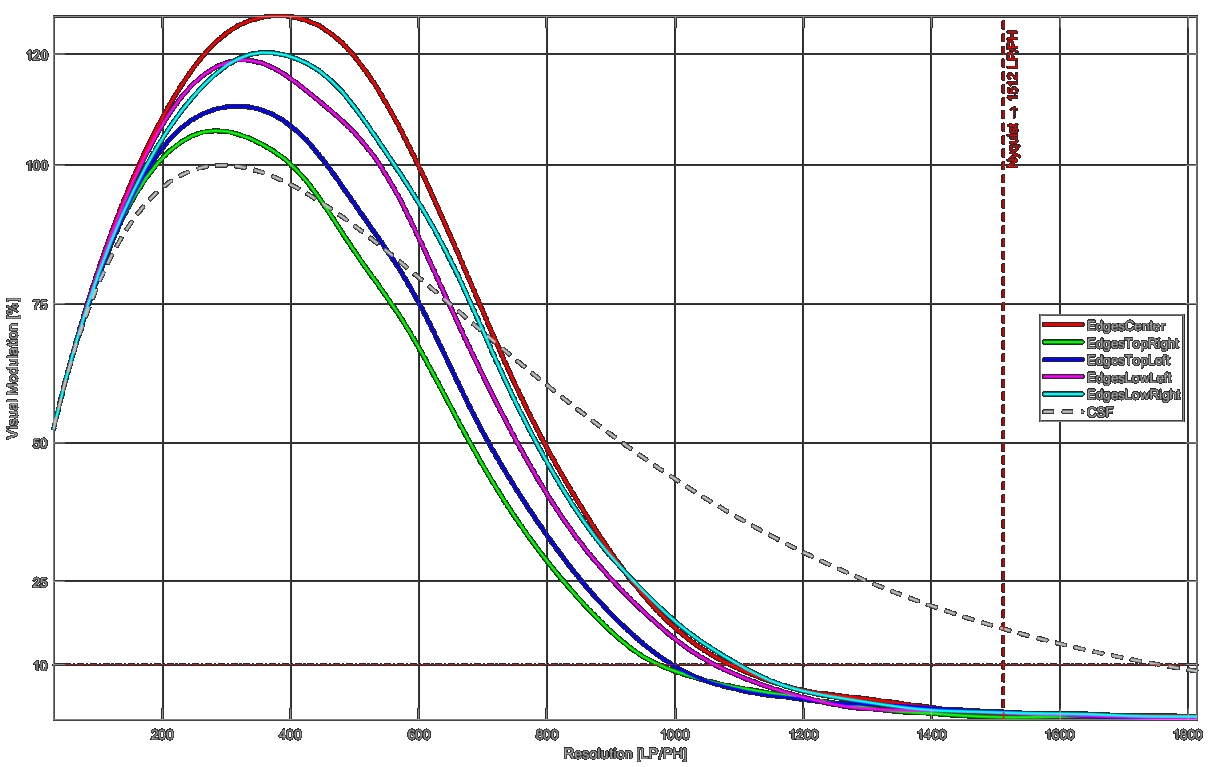
The evaluation process is updated regularly, with VCX 2025 marking a major shift toward user-centric design and measurement transparency. All test procedures are fully documented and reproducible, ensuring consistency between testing laboratories. Professional and detailed information can be found in the official white paper. If you have any further questions, please contact the VCX coordinator.